
At its core Community Health Maps (CHM) has always been a citizen science project. Since the beginning the most used and accessible component is community data collection. This is arguably the most important component as well. The foundation of any mapping project is data. While the world is awash in data, most of it is produced by federal and state agencies and importantly is not created at the community scale. After several years of teaching CHM workshops, one thing that is abundantly clear is that communities often know the issues affecting their public health better than anyone coming from the outside. With CHM, communities can gather data on these issues via the citizenry. CHM also allows agencies and NGO’s to leverage communities to crowd-source local data.What makes Community Health Maps so effective is the workflow based in open source and low cost software. This allows Community Health Maps to be scalable across neighborhoods, counties and larger regions. The technology is accessible because of the low cost of entry. QGIS is open source and free of licensing fees. Fulcrum has a very reasonable subscription rate. The tools used are also intuitive. This has allowed CHM to go into communities and train the local citizens in data collection in just a few short hours.
Pilot Projects
During the spring and summer of 2013 the first two CHM pilot projects immediately demonstrated this citizen science potential:
The Urban Indian Health Institute in Seattle, Washington used the CHM workflow in what is still one of the more creative applications: mapping noise in American Indian communities in Seattle. Noise pollution is an environmental health concern that has been linked to a variety of health conditions in both occupational and community studies. It is easy to measure with portable devices. One of the goals of this pilot was to evaluate the scalability of the workflow to the larger Urban Indian Health Organization (UIHO) The conclusion was the approach was ideal for crowd-sourcing data across the UIHO network.
Field Training
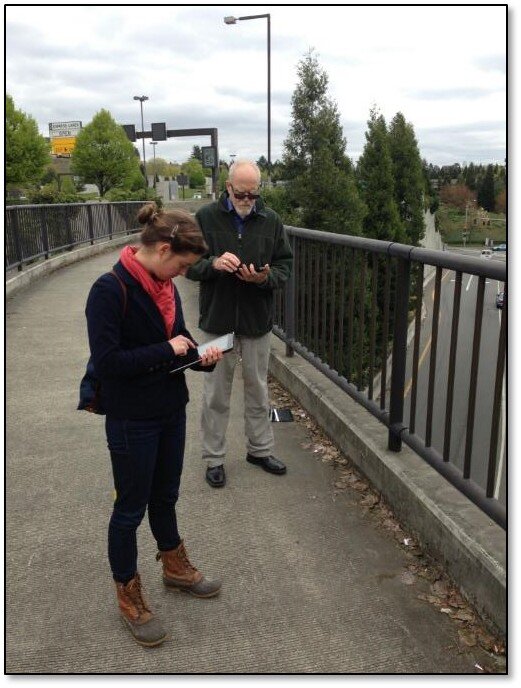
Papa Ola Lokahi with the Native Hawaiian and the Indigenous Health Office of Public Health Studies, University of Hawai’i Manoa used CHM to conduct windshield surveys of obesity factors in six Native Hawaiian communities.

Both of these pilot project implemented the train-the-trainer methodology. This allowed us to train community leaders, who in turn trained members of the community to collect the data.
Miami King Tides
The most recent and applied use of the CHM workflow in a crowd-sourcing effort took place in Miami in 2017. This is the most disaster-specific project CHM has undertaken and is still engaged in - the mapping of King Tides in Miami. King Tides is a term coined to refer to the highest tides of the year. They tend to come in the fall.
Researchers at Florida International University had already developed a data collection protocol involving data on water depth, salinity, and bacterial contamination. However, they lacked a workflow that would allow the results to be mapped. Plus the existing methodology made participation of the local community too complicated.

King Tide Data Collection Kit
The training was in two tiers. We first showed two professors at Florida International Universities Wetland Ecosystems Research Lab how to rebuild their data collection form in Fulcrum. We also obtained a Fulcrum Community grant making it even easier to have community members participate. Community leaders and residents were then trained in the data collection protocol and use of Fulcrum.

Miami Community Data Collection
The coalition of mappers included: Unitarian Universalist Justice Florida (UUJF), which coordinated the neighborhood program, along with New Florida Majority and Quaker Earth Care program. Jan Booher with UUJF documented the entire event on her ReACT Tool Kit blog.
A powerful component of a project like this is that local citizens are empowered. They can see what data is collected and how. Plus they have ownership in it. They are collecting data in their front yards, parks their children play in and streets they drive through daily. Their local knowledge improves the resulting data. Often they knew of specific locations where flooding was worst that should be captured. These locales would have otherwise been overlooked.
“Data gives people a window into low-income communities that they wouldn’t otherwise have,” Booher said. “People have confidence in data and can use and share it—even people who cannot articulate information can advocate for themselves. This process can give people a voice.”
This CHM data collection now happens annually and is available as open data via the Fulcrum Community page. This data allows people to create valuable maps which communities and academics alike can use to convey the situation to decision makers.
Booher added, “Maps have a way of communicating in a dispassionate way that is fact-based.”
