The First Vector Borne Disease Surveillance Workshop
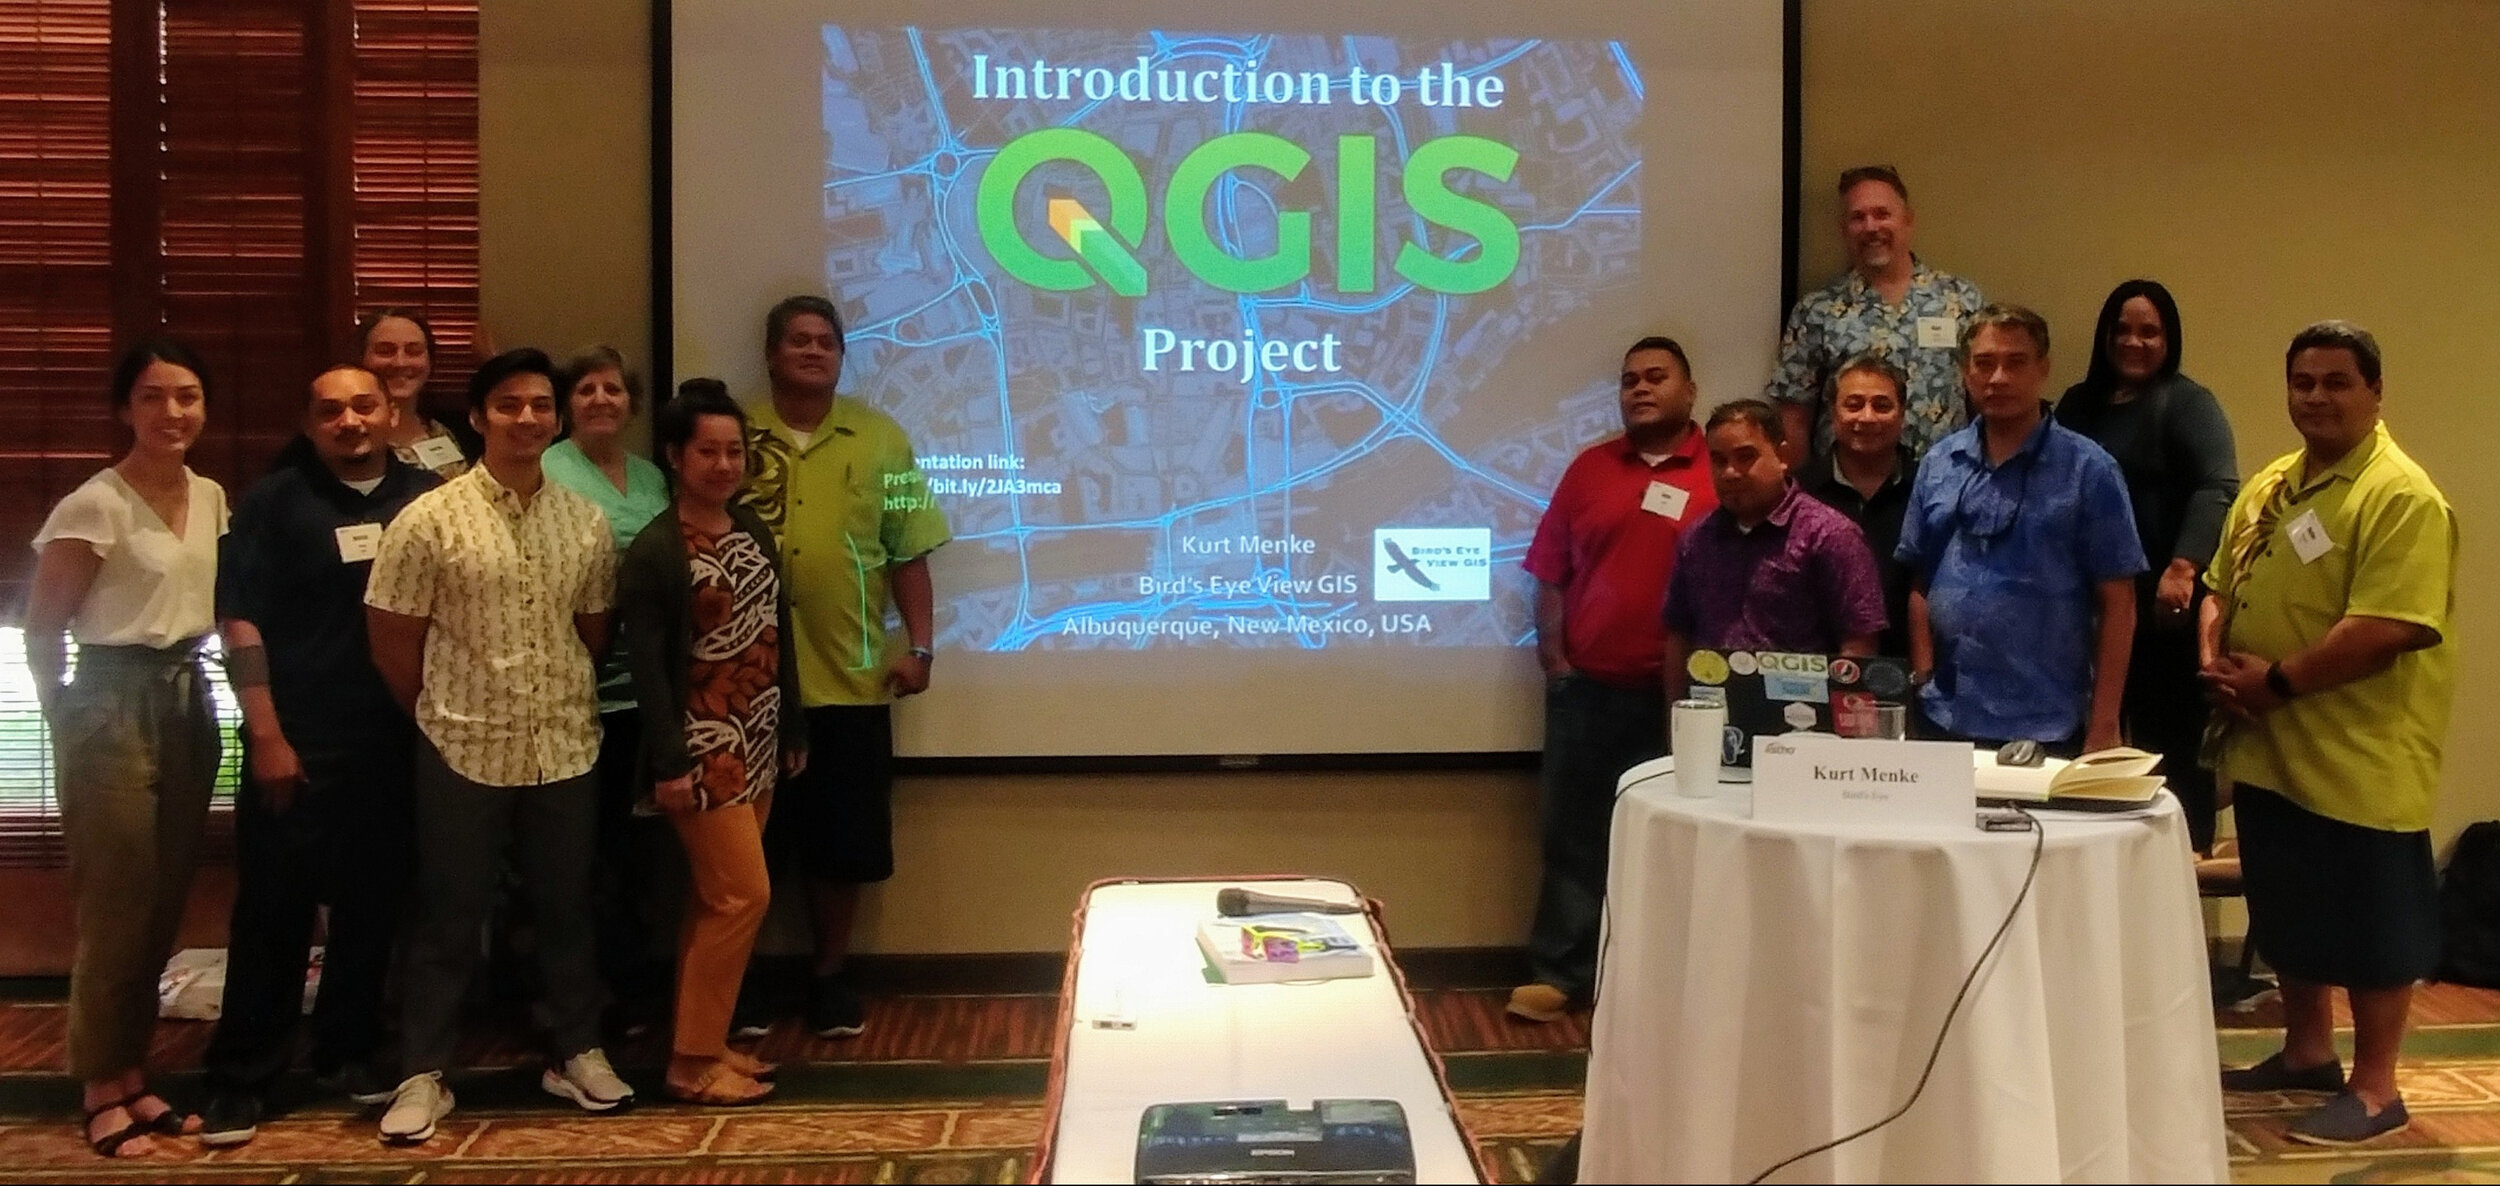 On June 8 & 9, 2019, twelve pacific island public health professionals met in Honolulu, HI to participate in a Community Health Maps training specifically designed to demonstrate how to collect and work with geographic data related to vector borne diseases, i.e. those that are transmitted to humans via other animals such as mosquitoes. Attendees represented: American Samoa, the Federated States of Micronesia, Guam, the Commonwealth of the Northern Mariana Islands, the Republic of the Marshall Islands and the Republic of Palau.This was the first of two, two-day, workshops aimed specifically at tackling the spread of diseases like Dengue fever, West Nile and Zika viruses. It was a team effort. The training was organized by the Association of State and Territorial Health Officials (ASTHO). Participants attendance was funded by CDC’s National Center for Environmental Health. Travel for the trainers was funded by the National Library of Medicine, (funding for the workshop is provided under a sub-award from the National Library of Medicine to ICF International). This particular CHM workshop was taught in conjunction with ASTHO’s Insular Area Climate and Health Summit.After an introduction to the Community Health Maps project - it's origins, workflow and examples of past projects - participants learned to create a data collection form and use their smartphones to map features (trees, signs, benches etc...) around the
 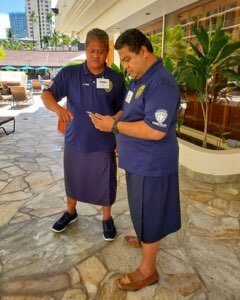 conference site using Fulcrum. Participants saw how this particular part of the workflow could be applied in their home regions to digitally locate areas of standing water and/ or sand pits that are some examples of breeding habitat for mosquitoes. Others anticipated mapping salt water resistant taro, households where infections have occurred and other geographic factors that contribute to the spread of vector borne diseases.For the remainder of the first day the group took the data they created earlier and imported into QGIS, a sophisticated geographic visualization desktop software. In this section they became familiar with QGIS and how to symbolize layers and make a print map.In addition to the data collected on site, we worked with mosquito data acquired courtesy of Dr. Chris Barker covering Madera County, CA. The data included mosquito trap results over five years, virus testing, mosquito biting complaints, storm drains, parcel boundaries, roads and a hypothetical case of Dengue fever.
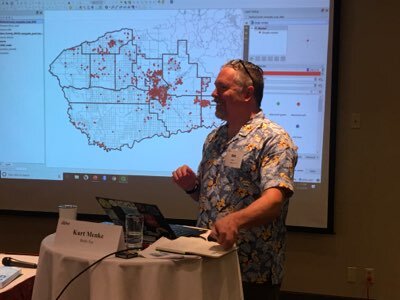 The second day focused on generating vector borne disease surveillance products. Kurt Menke developed a curriculum to demonstrate how a GIS can create maps and statistical charts that transform simple text and numbers in a database into intuitive graphics that communicate information quickly and accurately. The previous blog post has more detail about the specific vector borne disease surveillance products participants learn to create.
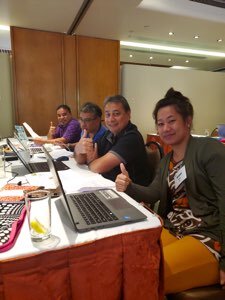 The attendees had a wide range of GIS skills from introductory to advanced capabilities. We experienced many of the common technical difficulties when working in a hotel conference room, older and newer computers and variations with different operating systems (Windows and Macs) as well. Despite all the differences, all of the participants: A) collected data with their smartphones, B) exported their data to a desktop GIS, C) used prepared data to create geographically accurate statistics, D) generated heatmaps of mosquito populations, E) calculated the minimum infection rate per year for West Nile and St. Louis Encephalitis viruses, F) identified potential sources using buffer operations with distances specific species are know to be able to travel, G) identified parcels at risk due to their proximity to a fictional outbreak of Dengue Fever and H) generated trend graphs of mosquito populations through time via the QGIS Data Plotly plugin. All participants received official QGIS certificates.The skills required to complete these tasks are not always simple and straight forward. The participants of this workshop expressed great enthusiasm and persistence in figuring it all out... making mistakes and trying again. Many expressed a need for more training and a desire to have more specialized trainings on site specifically related to projects they are already working on.The second workshop in the series will be taught next week in Providence, RI at the GIS Surveillance Workshop. This will be attended by State based health officials.This vector borne disease surveillance version of the Community Health Maps workflow showcases the analysis and data visualization capabilities of QGIS, as well as, the data collection capabilities of Fulcrum. It represents perhaps the greatest potential for applied use of Community Health Maps to date.These workshop materials will part of the suite of https://communityhealthmaps.nlm.nih.gov/resources/ available through the Community Health Maps program in the near future.If you are interested in having this taught for you or your colleagues contact Kurt Menke (kurt@birdseyeviewgis.com)