This post will show the basic steps for working with an alternative to Fulcrum for community data collection with a smartphone. The app is named Input. It’s a mobile app developed by Lutra Consulting. The app is free. Until now it was only available on Android. However, Lutra Consulting is working on a version for iOS! The Input workflow is based in QGIS. This means you set up your data layers in QGIS, along with the logic for your data collection. (This will mean a steeper learning curve for those not already familiar with QGIS. But don't let that discourage you, it is not that much steeper!) You then use their Mergin cloud service to synchronize your QGIS project and data between your desktop and phone. There is a Mergin QGIS plugin making this quite simple. All the symbology you set up with your data in QGIS will be honored by the Input mobile app. With the combination of QGIS and Input/Mergin you can mimic all the field data collection functionality covered in a typical Community Health Maps workshop!
Getting started
Here I will walk through the steps in setting up the same type of data collection in CHM workshops. (Note: this post was inspired by the well done video by Dr. Hans van der Kwast on using Input). To get started:
- Create a folder for your project
- Open QGIS (in this example I’m using v 3.8).
- Install the QuickMapServices plugin and add the OSM Standard and Google Satellite basemaps.
- Zoom in to your study area.
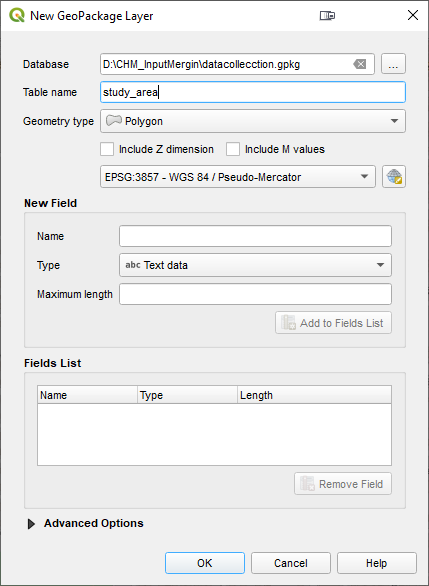
This step is optional but helpful. You will set up a layer as the study area boundary. From the QGIS menu bar choose: Layer | Create layer | New Geopackage Layer.
- Save the Database (*.gpkg) into your folder.
- Table name = study_area
- Geometry type = Polygon
- Click OK.
Now that the study area has been created, the polygon for the study area can be digitized and then styled. Right-click on the layer and choose Toggle Editing from the context menu. Use the Add Polygon Feature tool on the Digitizing toolbar to trace your study area.
Styling the Study Area
Clicked F7 to open the Layer Styling Panel. Here I gave the polygon a Fill Style of No Brush, a Stroke Color of bright red and a Stroke Width of 1.26. This study area covers a school and park near my office.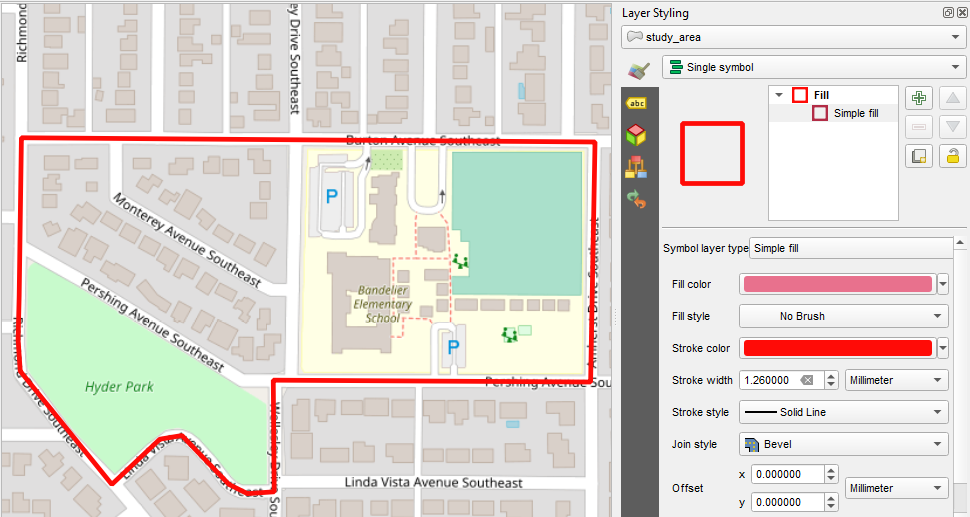
Creating the Infrastructure Points Layer
This is more important. Create a second layer into which you will record points out in the field. Repeat the above steps to create a point layer and save it into the same GeoPackage. Name the Table infrastructure and set the Geometry type to point. Before clicking OK you will add columns to record the data you will collect. For each new column, enter the name, set the Type , Maximum length and click the Add to Fields list button. (Although not in the screenshot below you can also choose to add a date column - type = DateTime.) When you have added each field click OK to create the layer. 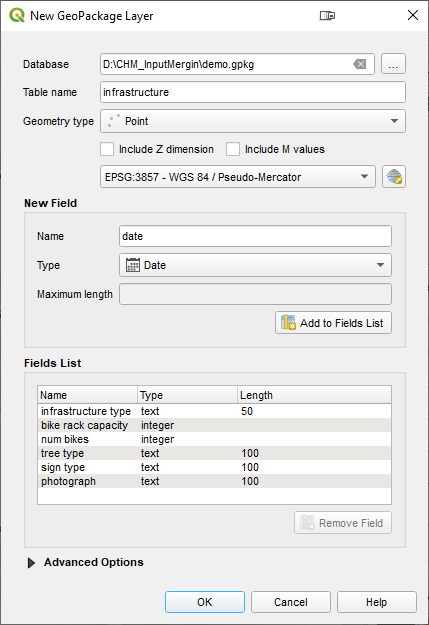 When saving, choose Add New Layer so the layer is added to the existing GeoPackage.Now symbolize the points. Here I have used to Simple markers to create a purple target icon.
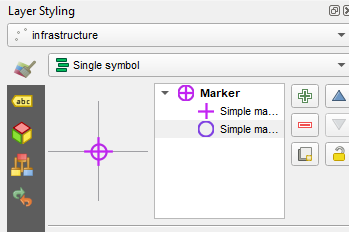 Save your QGIS project as a QGS file into the same folder. (At the moment Input does not support the zipped default QGZ project file format.)
Creating Offline Basemaps
If you have a cellular connection the basemaps will work fine. However, if you anticipate losing cellular connection out in the field, you can use the Generate XYZ Tiles (MBTiles) processing tool to create offline versions of each basemap. You can set the extent to that of your study area layer. You will need to experiment with the zoom level settings. When they have been created you can use the Browser Panel to add these to your map. 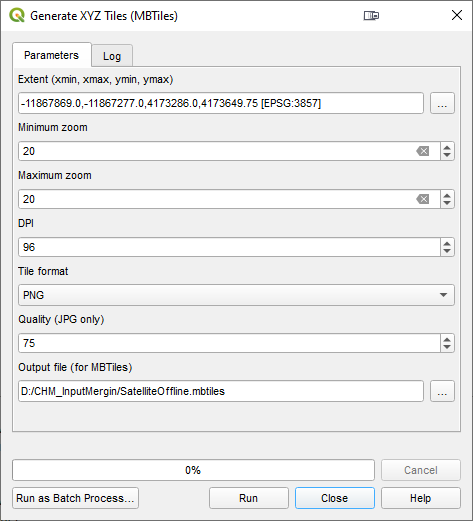
Working with Map Themes
You can also set up Map Themes. These allow you to have different views of your map. Clicking the eye icon at the top of the Layers Panel will open the Map Themes menu. For example, to set up a map theme for just the Offline Satellite layer the study area and your point layer, you would just turn those three layers on. Then choose Add Theme and name it Offline Satellite from the Map Themes menu. Here I have set up several themes. With these I can easily toggle between these different views while in the field. 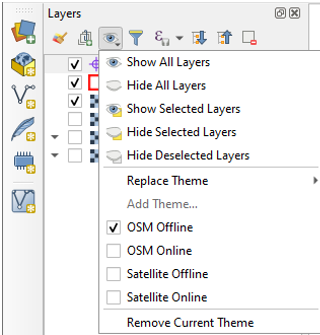
Setting Up Field Widgets for the Points Layer
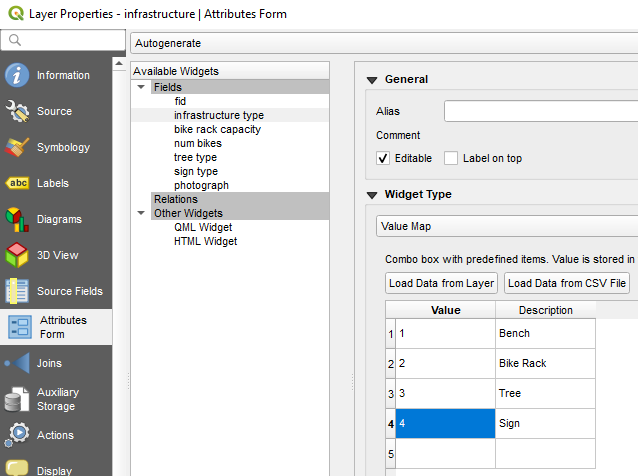
The next steps are key for mimicking the data form functionality in Fulcrum. You will open the Layer Properties for the point layer, and switch to the Attributes Form tab. Here you can select each Field, and set up custom widgets which will control the editing behavior in the field. Below are the fields typically used in a CHM workshop.
- fid - you don’t need to see this field, so select it and choose a Widget type of Hidden.
- Infrastructure type - Select a Widget type of Value map. Here you can enter a series of choices with 1-x values. Under Constraints check Not Null which makes this required data.
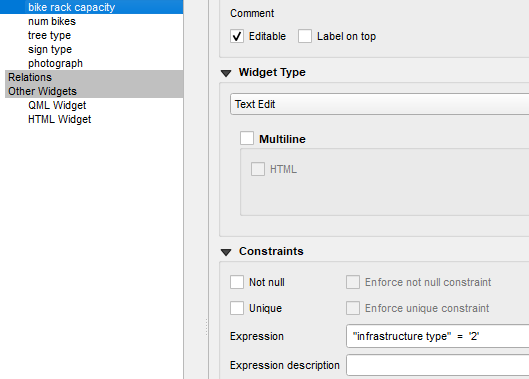
- Bike rack capacity - Select a Widget type of Text Edit. This allows the data collector to type the number for this. Since this only needs to be answered if the infrastructure type = Bike rack you can enter that as an expression in the Constraints section.
- Num bikes - set this up the same as the bike rack capacity.
- Tree type - Widget type = Text Edit and you can set up the appropriate Constraint expression for this.
- Sign type - Widget type = Text Edit and again set up the appropriate Constraint expression.
- Photograph - Widget type = Attachment. In the Path section click Relative paths. Then scroll down to find the Integrated Document Viewer section. Set the Type to Image.
- Date - Set the Field Format to Date. Uncheck Calendar popup. Under Constraint check Not Null. Then in the Defaults section enter $now which will default to today's date.
Close Layer Properties and save your project.
Project Properties
Now there is just one more setting to create. From the Project menu choose Properties and switch to the Data Sources tab. Here check the box making the study_area Read only. This layer is just for reference and will not be edited in the field.Save your project.You are done with the set up and will now use the Mergin plugin to migrate your data to the server. In QGIS install the Mergin plugin.
Setting Up Mergin
Visit the Mergin web page (https://public.cloudmergin.com) and set up an account. With the free account you get 100Mb of data storage. (You can inquire with Lutra Consulting about getting additional cloud storage space.) In the QGIS Browser panel you will see a new Mergin data provider. Click on it and when prompted enter your credentials.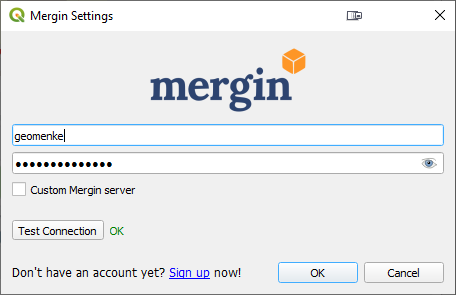 In the Browser panel again right-click on the Mergin icon and choose New Project. Fill in the details and click OK. The data will upload to your cloud account.
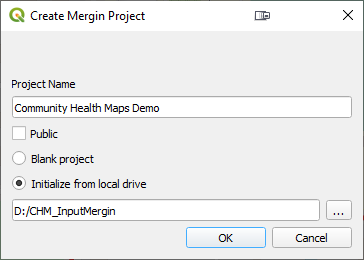
Collecting Data with Input
Now that the project is uploaded to the Mergin server you can switch to your smartphone. Install the Input app. Log in with your credentials and you will be able to access your project from the Projects list. You can then use the More option to switch between different map themes.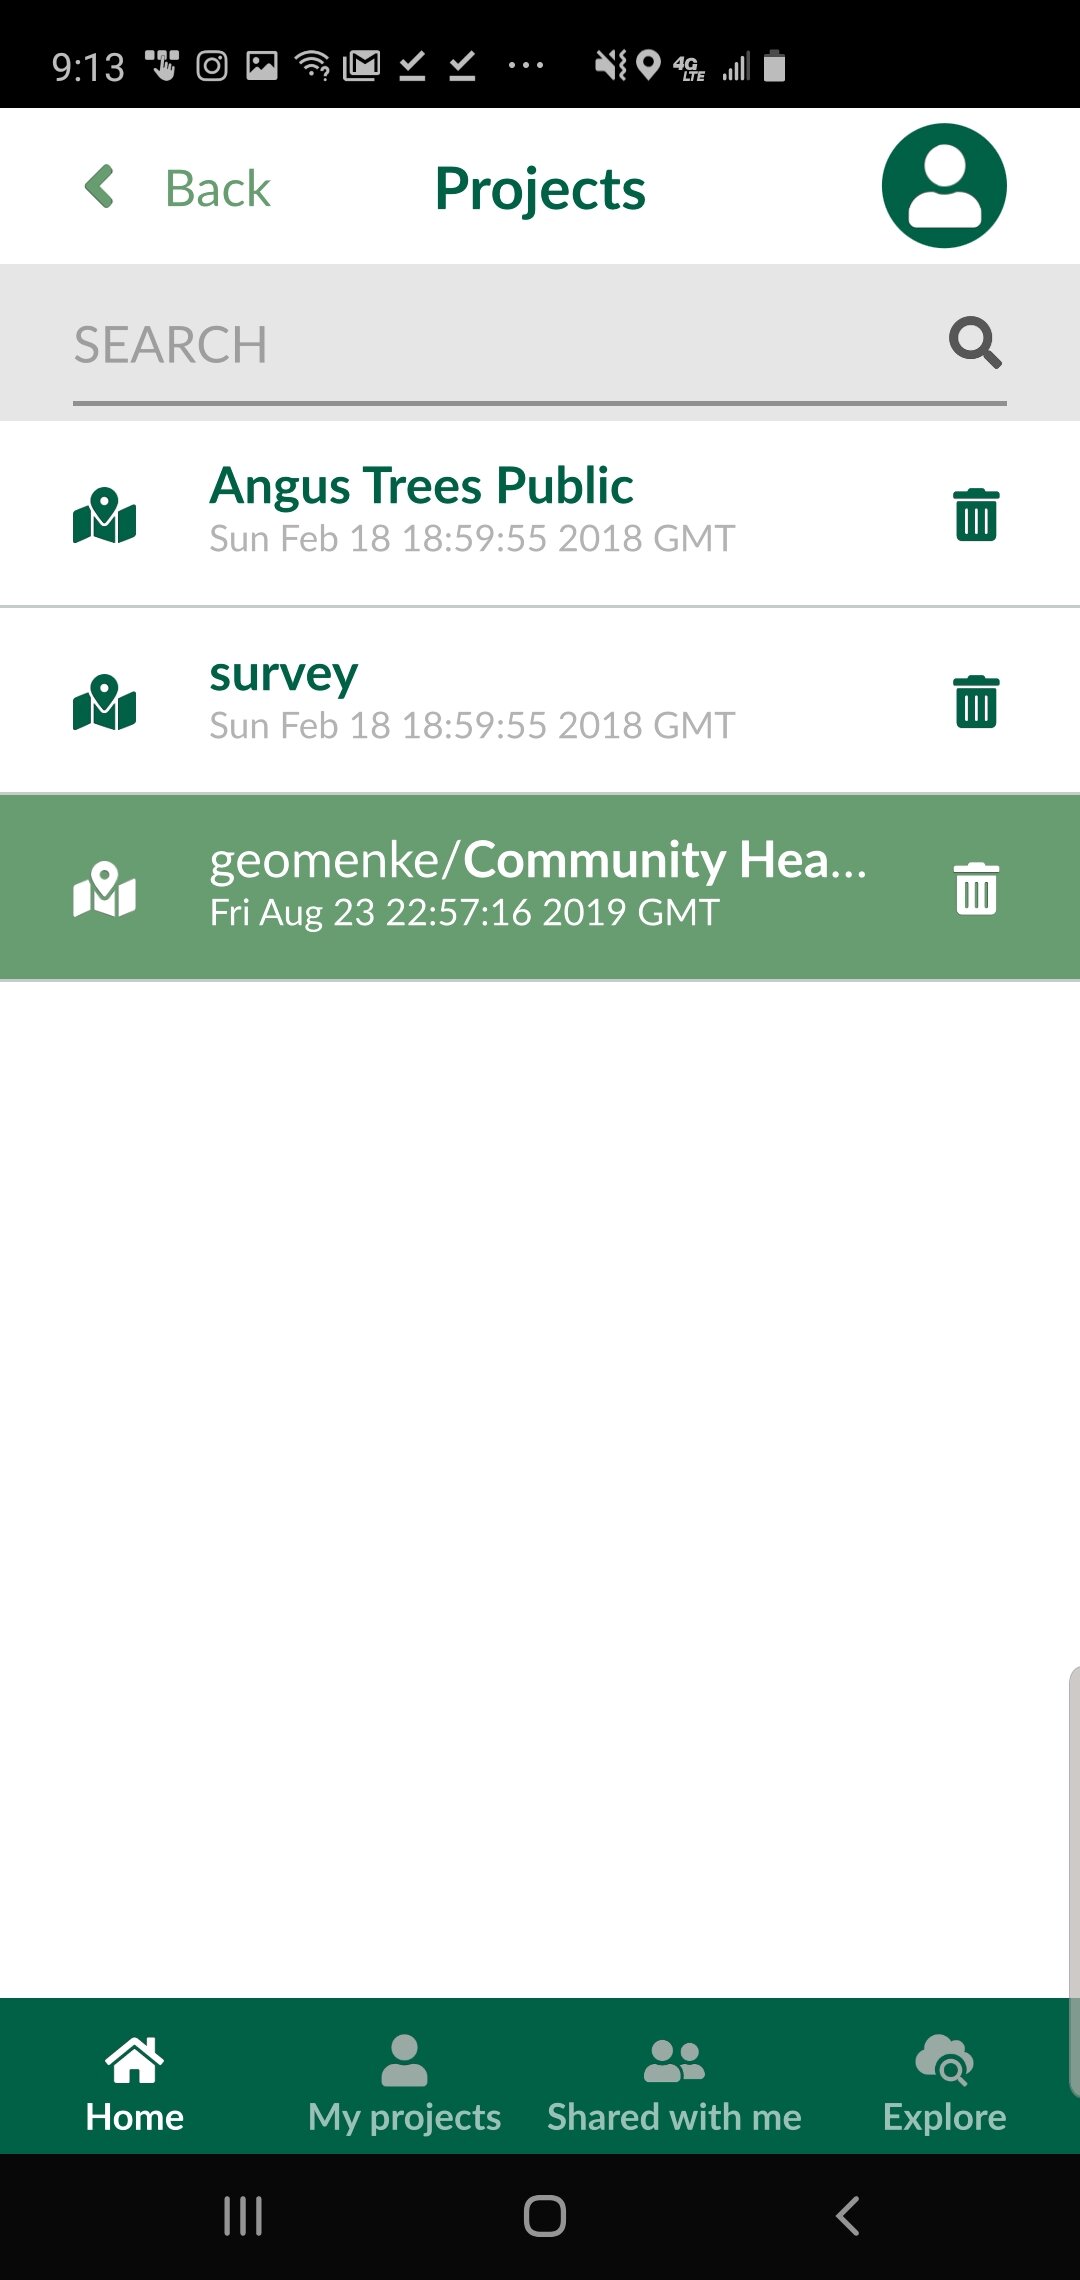 When you are ready to collect a point, click the Record button and then the Add Point button. The form will open allowing you to collect all the data for that feature including a photograph. The points which have a condition preventing them from being entered will be unavailable and red. For example, the animation below shows a Stop sign being collected. The fields related to other things (bike racks and trees) are unavailable because a condition has been set within QGIS. Once the information has been entered simple click Save and move to the next data collection point.
Downloading/Synchronizing the Data
When you are ready to download the data you can either 1) Use the Mergin data provider via the QGIS Browser panel to Synchronize your data, or 2) Synchronize the data via the Mergin website. You can then open the updated project from the same Mergin provider and begin to work with your data!
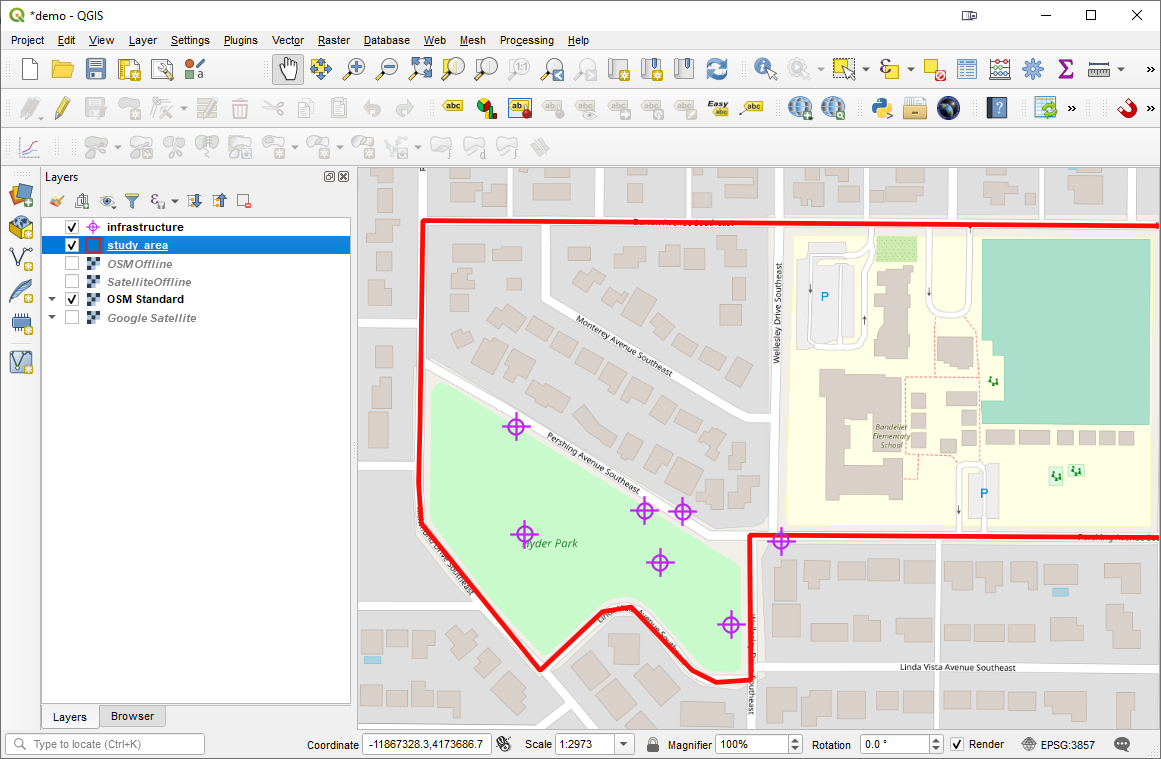 This is still a very new app but shows immense promise for Community Health Mappers. I encourage Android users to try it out. iOS users stay tuned for future developments.