To start the New Year I thought I’d begin with a review of Community Health Mapping (CHM). There are a lot of new project partners, and I thought it would be a good time to give a project overview. CHM is a collaborative effort between the National Library of Medicine, Center for Public Service Communications and Bird’s Eye View. The National Library of Medicine is funding the initiative.The overall goal is to empower community organizations serving vulnerable or underserved populations with low cost, intuitive mapping technology. Therefore we’ve been working with programs organizations who:
- Focus on vulnerable populations
- Frequently use and collect data
- Need effective, scalable & easy to use mapping tools
- Lack resources (i.e., for proprietary GIS training & software)
We have identified a suite of tools that allow you to collect custom field data, analyze that data, combine it with other spatial datasets, and generate both static maps and/or dynamic maps on the internet. This allows organizations to collect and work with their own data, and if appropriate, share it with others. CHM involves three components that meet all basic mapping needs:
- Field Data Collection
- Desktop Analysis and Cartography
- Internet Mapping
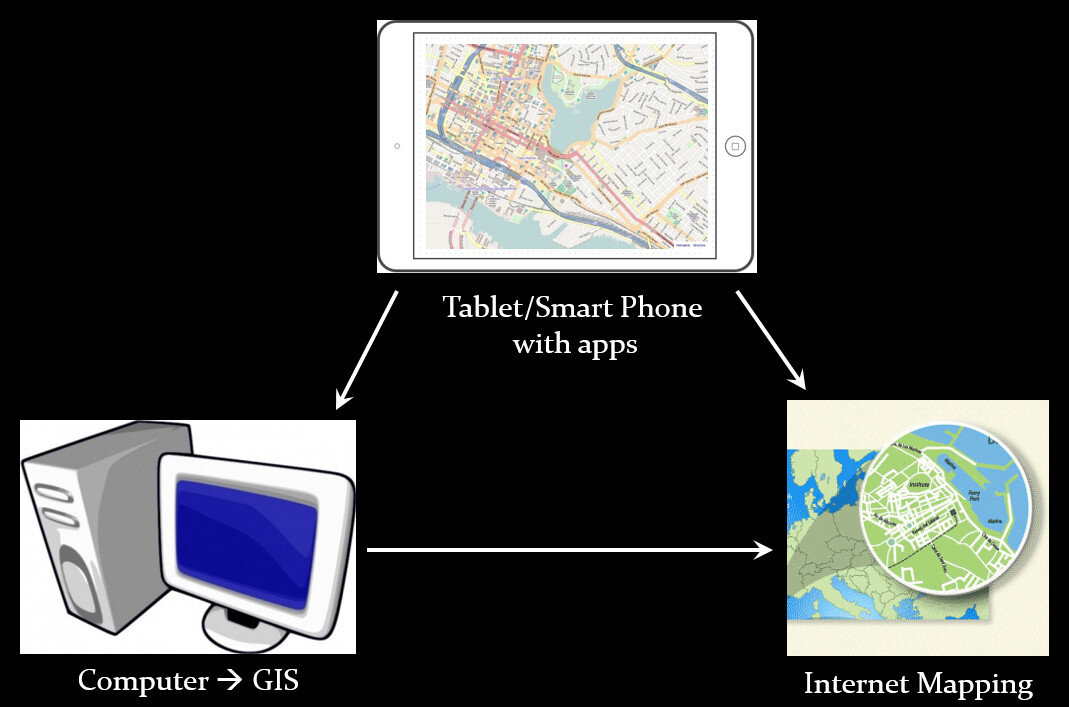 A given project may not require all three, however, collectively these components address the basic needs of all mapping projects.Field Data Collection:Rather than focusing on the use of expensive GPS receivers, we recommend the use of smart phones and tablets for these reasons:
- Most community-based organizations already have them!
- Many know how to use them
- They're intuitive
- They're portable
- They come with an on board GPS receiver (iPhone 5 uses GPS + GLONASS)
- Have on board cameras
- Can connect to wireless networks
- Access to the internet
- Email is available
- “There's an app for that!”
 Of course an important consideration is horizontal accuracy. You can read our blog post on that topic to see if mobile smart devices meet your project needs.When collecting data you need to be able to develop your own custom data collection form. The top three mobile apps we have found are:
- Fulcrum: Easiest to use - iOS & Android – low monthly subscription - http://www.fulcrumapp.com/
- iForm: Slightly steeper learning curve – iOS and Android – free account - https://www.iformbuilder.com/
- ODK Collect: Easy to use – Android only – free account - https://opendatakit.org/use/collect/
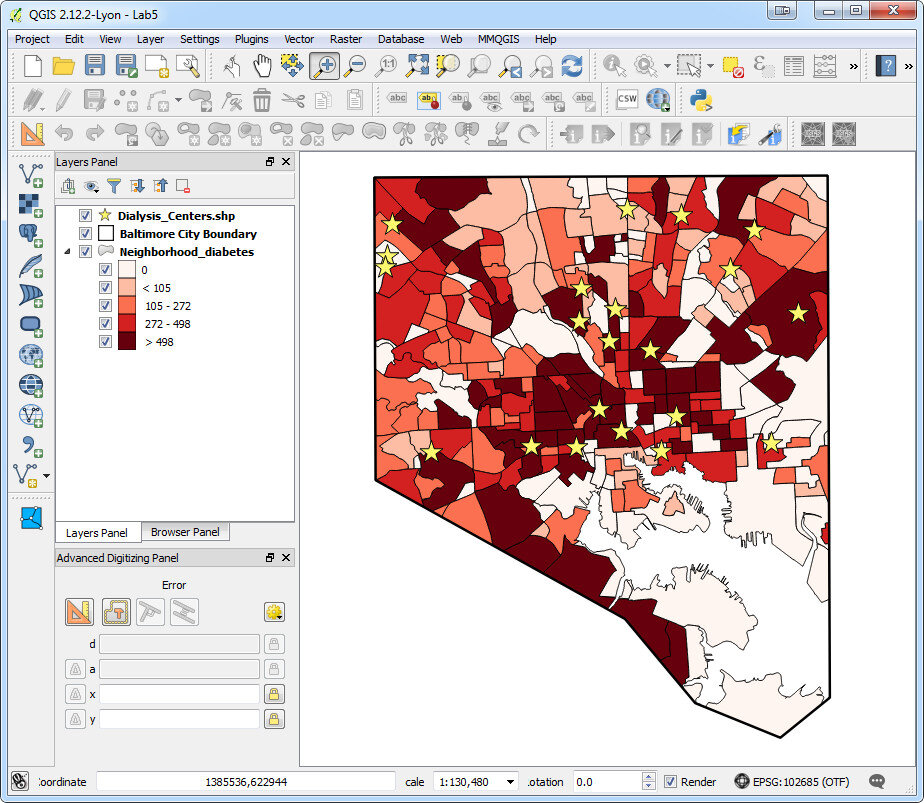
Desktop Analysis and Cartography:After community field data collection, the next step typically involves bringing the data into a desktop GIS. This is the middle step in the workflow. Here the data can be viewed against basemaps such as Google or OpenStreetMap, and combined with other organizational data. This is also where analyses (proximity, density etc.) can be conducted. Presentation quality maps can also be generated in this step.The software we found to be the best fit is QGIS. This is an open source desktop GIS software. It has many strengths:
- It can consume many kinds of data, including all the data that would come out of the field data collection apps.
- It is both intuitive and robust.
- It has a large suite of geoprocessing tools for analyzing data.
- It will run on Windows, Mac, or Linux.
- It is free to download and install.
- It is well documented.
- There is a large user community.
- New functionality is being continuously added. New stable versions are being released every 4 months!
 Web PresentationOften you may want to present an interactive map of your results. Interactive means the map reader can zoom in/out, pan the map and turn layers off and on. For this we recommend CartoDB.You can sign up for a free account, which gives you 50Mb of storage space. Data can be collected with a smart phone or tablet and brought directly into CartoDB. It is a very intuitive platform. You can literally drag and drop a spreadsheet onto the CartoDB page and have the data upload to your account. It will accept the most common geospatial file formats including: spreadsheets and comma delimited text files with addresses or coordinates, KML/KMZ, GPX, and shapefiles.CartoDB also has great documentation including:
- CartoDB Editor Documentation
- A comprehensive series of tutorials breaking tasks up into Basic, Medium and Advanced categories
- Tips and Tricks
- FAQ’s
 In ConclusionThis blog has a lot of resources including reviews of mapping technology and case studies. You might begin by clicking on some of the links in this entry. We are also working on a 6 lab CHM curriculum that interested parties will be able to use to hone their skills. Stay tuned for that!We are always looking for new partners and continuously work to support current project partners. If you are interested, or have questions please don't hesitate to contact John Scott (jscott at cpsc.com) or Kurt Menke (kurt at birdseyeviewgis.com). Most importantly get out and do some mapping in 2016!