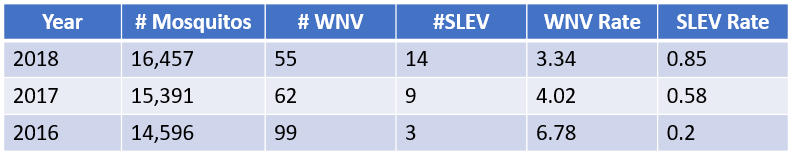
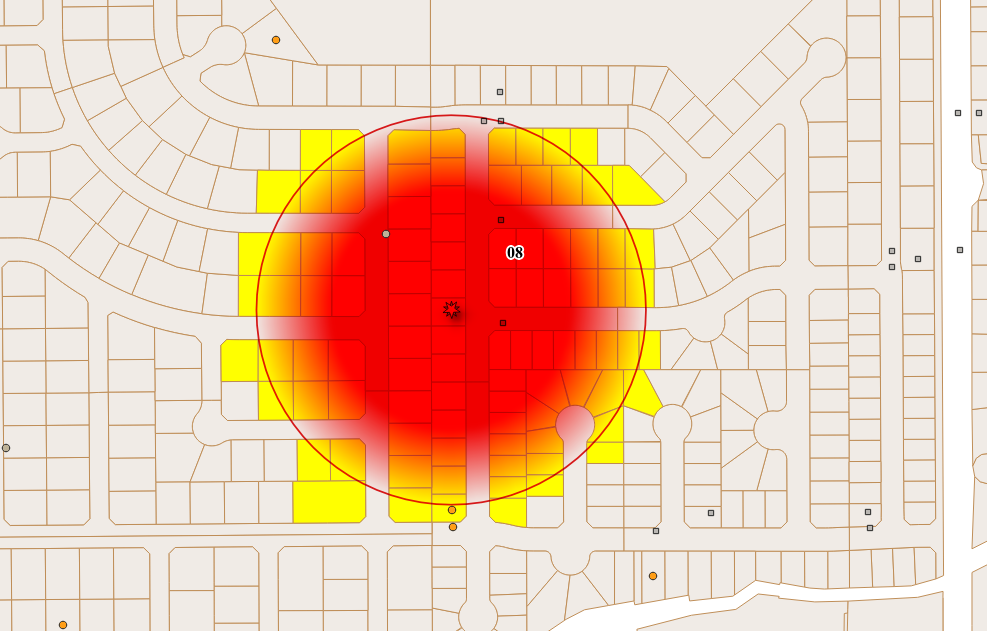
This spring, with funding provided by the Association of State and Territorial Health Officials (ASTHO), Kurt Menke developed a two day workshop that combines elements of the standard Community Health Maps workflow with vector borne disease surveillance analyses.The workshop begins with an introduction to Community Health Maps, and learning how to use Fulcrum to develop a data collection form and collect community GIS data with a smartphone. Participants will then be introduced to QGIS. They will learn how to add the field data just collected, and symbolize it. They will then download some open data and create a map.The second day focuses on a suite of mosquito trap data acquired from Madera County, CA, by Dr. Chris Barker at UC Davis. There are 5 years of mosquito trap data and mosquito virus testing data. There are also anonymized data for mosquito biting complaints, mosquito management zones, storm drain locations, parcels and roads.Collectively this provides a rich yet manageable dataset. With it participants will learn to use to create information such as: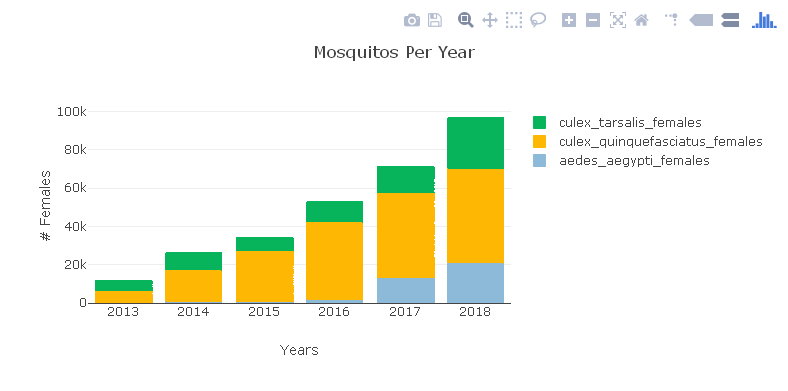

 This workshop represents applied real-world workflows. These are many of the standard products needed by public health officials and typically produced by researchers. Having this sort of analysis and data visualization available via an open source package means anyone willing to take a few days to learn can produce them! This is especially true as the needed input data can be collected via Fulcrum if they don't already exist.This workshop will be taught twice in June. Both workshops will be part of the Community Health Maps project and are partly funded by the National Library of Medicine (funding for the workshop is provided under a sub-award from the National Library of Medicine to ICF International). The first iteration will be taught in conjunction with the Insular Area Climate and Health Summit in Honolulu, HI. This will be attended by public health officials from many of the Pacific Territories.The second workshop will be taught in Providence, RI at the GIS Surveillance Workshop. This will be attended by State based health officials.This material really showcases the analysis and data visualization capabilities of QGIS. It represents perhaps the greatest potential for applied use of Community Health Maps to date. This workshop will part of the suite of Resources available through the Community Health Maps program in the near future.If you are interested in having this taught for you or your colleagues contact Kurt Menke (kurt@birdseyeviewgis.com).