Submitted by Jenny Rewolinski, University of Maryland, B.S. Community Health 2016I just completed a spring internship with the National Library of Medicine (NLM). My goal was to demonstrate what a typical user of the Community Health Maps (CHM) blog might experience, while using the low cost resources it reviews to develop a mapping project with a public health focus. I read through the case studies on the CHM blog and used its labs to develop my project plan and to guide my related decisions.Because of my experience with elderly relatives and my background in public health, I centered my project on how the senior population of a nearby Assisted Living Facility might safely navigate local sidewalks. According to the 2014 American Community Survey, 23% of people over 65 have some sort ambulatory disability. With this in mind, I decided to map local curb ramps --sloped transitions between sidewalks and streets which function as accessibility enhancements to help those with mobility issues to cross streets safely.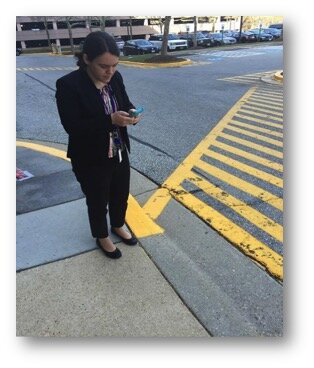 I used CHM Lab 1: Field Data Collection to learn how to design my own data collection form using iForm. My Curb Ramp form captured curb ramp location, conditions, and other observations such as seniors using the curb ramps, steep or damaged curb ramps, and a lack of sidewalks in the area. As discussed in a prior blog post, How Accurate is the GPS on my Smart Phone?, phone geolocation is usually accurate up to 8 meters. This was not precise enough for my curb ramp data, so I corrected for this on my form. Over the course of 8 hours spanning 2 days, and with 2 other interns I collected 103 existing curb ramps and locations where curb ramps might aid accessibility.
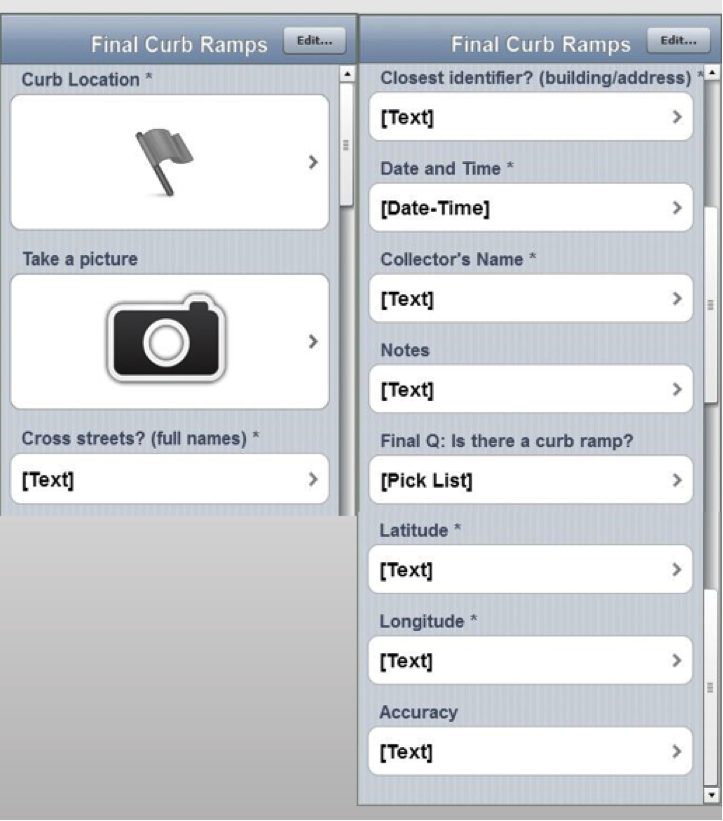 Next, I brought my iForm curb ramp data from my phone into the QGIS software by using instructions from CHM Lab 2: Bringing Field Data into QGIS. I also used CHM Labs 3: Combining Field Data with Other Organizational Data and CHM Lab 4: Basic Spatial Analysis to add data layers and to perform spatial analysis to finalize my map.
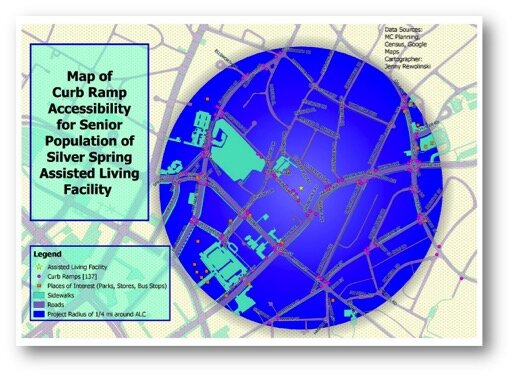 This is my project map! I completed construction of my map using CHM Lab 5: Cartography with QGIS. In addition to my curb ramp data points, I added data layers for sidewalks, roads, places of interest (such as grocery stores, restaurants, bus stops, theaters), and my Assisted Living Facility. My goal was to raise awareness of how accessibility can impact seniors’ sense of autonomy and empowerment, and their ability to exercise and to lead a healthier lifestyle. This map also provides recommendations for where more curb ramps should be placed based on observations during data collection. I plan to discuss this map and curb ramp recommendations with the city of Silver Spring and to create “safest route” guides for popular local destinations.
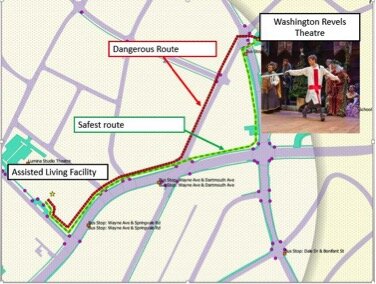 GIS has a huge potential to help us analyze health issues. When I began my project at NLM, I thought I would simply be mapping the location of curb ramps near a local Assisted Living Facility; however I discovered the significant need for more curb ramps as well as sidewalks around my project area.I believe the conclusions I was able to reach by using the low cost CHM resources CHM are accurate and workable. I came to NLM with little to no GIS knowledge yet I learned from the CHM GIS labs, collected curb ramp data points and created a map that may bring awareness to a public health issue. In doing so I believe my experience is typical of many CHM users.