
By John C. Scott - Center for Public Service Communications
Community Health Maps (CHM) recently joined forces with community based organizations and residents in North Miami, and Florida International University faculty to map health risks associated with the 2017 King Tides, September 19th and 20th and again on October 7th , the time of the highest of the inundations.
Several communities in Miami experienced predictable tidal flooding during the highest tides of the year. The Shorecrest community is among them. Sampling of the flood waters during previous King Tides has established that they contain elevated concentrations of bacteria. The aim of this project was to prepare residents of the community to record and map data that will help them plan their daily activities to protect their health, and give them tools to communicate with the city and county about their environmental health risks.
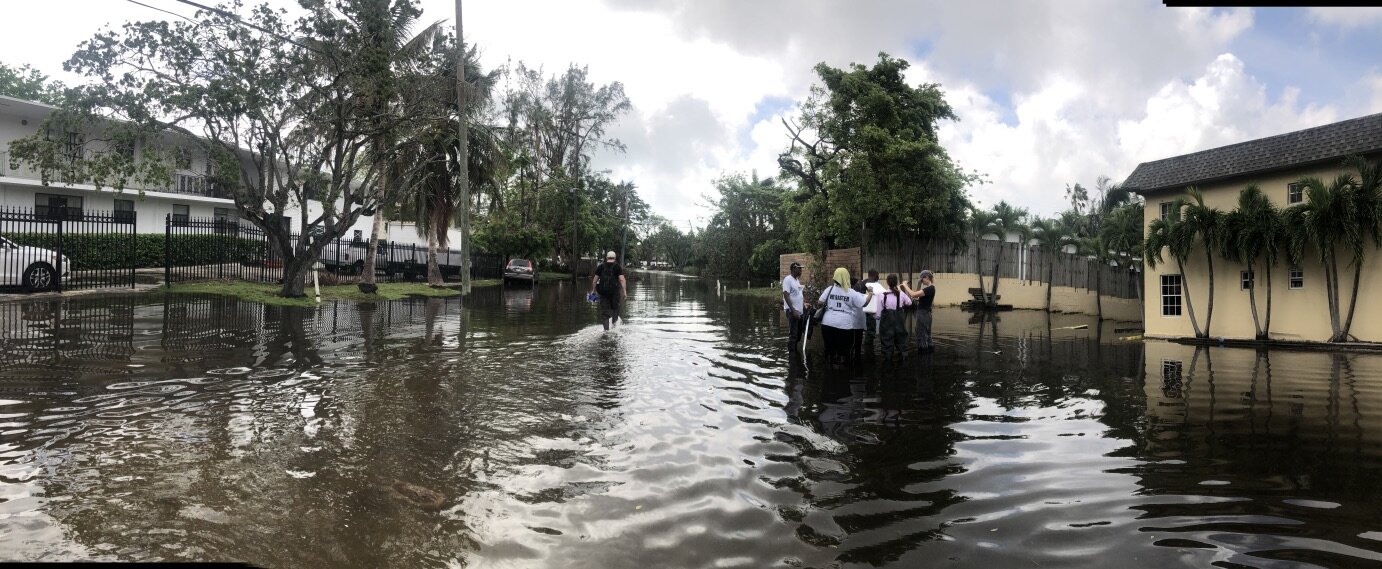
King Tides flood the streets of the Shorecrest neighborhood while community members collect data.
Complicating the task of collecting data in the community was Hurricane Irma which hit South Florida only a week before the September measurements, causing dislocation of residents, power outages and other disruptions that resulted in the decision not to tax neighborhood residents by expecting them to learn the CHM workflow and map hazards in the community.
For the CHM/King Tides mapping project, community members were trained on the CHM workflow before collecting and mapping environmental health data during the King Tides in the Shorecrest community of Miami. A physical tool box containing needed technology, sampling equipment, key contact information, and protocols for community engagement in data collection during King Tides was created by Jan Booher of Unitarian Universalist Justice Florida and Drs. Tiffany Troxler and Susan Jacobson of Florida International University Wetland Ecosystems Research Lab and School of Communications, respectively. Based on the initial data collection and mapping effort with the Fall 2017 tides, a community report will be generated in collaboration with community leaders to be shared with residents and decision-makers in the community and with appropriate members of City of Miami and Miami-Dade County staffs.
For those of you who are new to Community Health Maps, the initiative was founded on the premise that community-based organizations, environmental health advocacy groups, public health agencies are in a better position to serve their constituents when they can collect and maintain their own data, rather than relying solely on national, state or city agencies, or majority-institution partners to provide data to them.
The CHM approach involves using relatively low cost tablets and smartphone platforms, combined with a selection of low/no-cost applications that run on them, to collect data in order to better understand health status or health risks to the community and support decision-making leading to appropriate allocation of resources to improve health conditions and prevent or mitigate risk. Using the CHM workflow, those data can then be analyzed, shared and presented using low cost/open source software. These tools allow expert and novice users, with little budget resource, to implement mapping workflows.
A common way in which prospective users have learned the CHM workflow is through our CHM Training Workshops. The CHM workshop presents an opportunity to learn and discuss new ideas and methodologies, which will empower community organizations, teachers, and students serving vulnerable or underserved populations with low cost, intuitive mapping technology. During the workshops, we also share experiences where the CHM workflow has helped MPH programs and other academic health centers and community-focused organizations visualize their data and better understand and portray their significance to the community.
The Florida King Tides was a more ambitious project than usual for CHM. While most of the work of the CHM team consists of training and building capacity of communities to map and better-understand their health risk to environmental factors, this was our first opportunity to work in the field with users of the workflow. Together with the core CHM team of NLM, Center for Public Service Communications and Bird’s Eye View, CHM teamed with Unitarian Universalist Justice Florida (UUJF) and it’s The Rising Together project, which works residents in vulnerable communities in coastal Florida about how to prepare for and react to the public health effects of climate change. Through its association with UUJF, the Community Health Maps team also trained and worked with Quaker Earthcare Witness, New Florida Majority, and Florida International University’s Wetland Ecosystems Research Lab and School of Communication and Journalism.

Map made in QGIS of the September King tide data collection showing flood water salinity levels.
It is our vision that data collected by neighborhood residents about conditions affecting environmental health can be visualized via CHM, together with databases available from city, county, state and federal governments to, as one example, identify potential predictable impact of future king tides so that public transportation and school walking routes can be modified to avoid health risks.
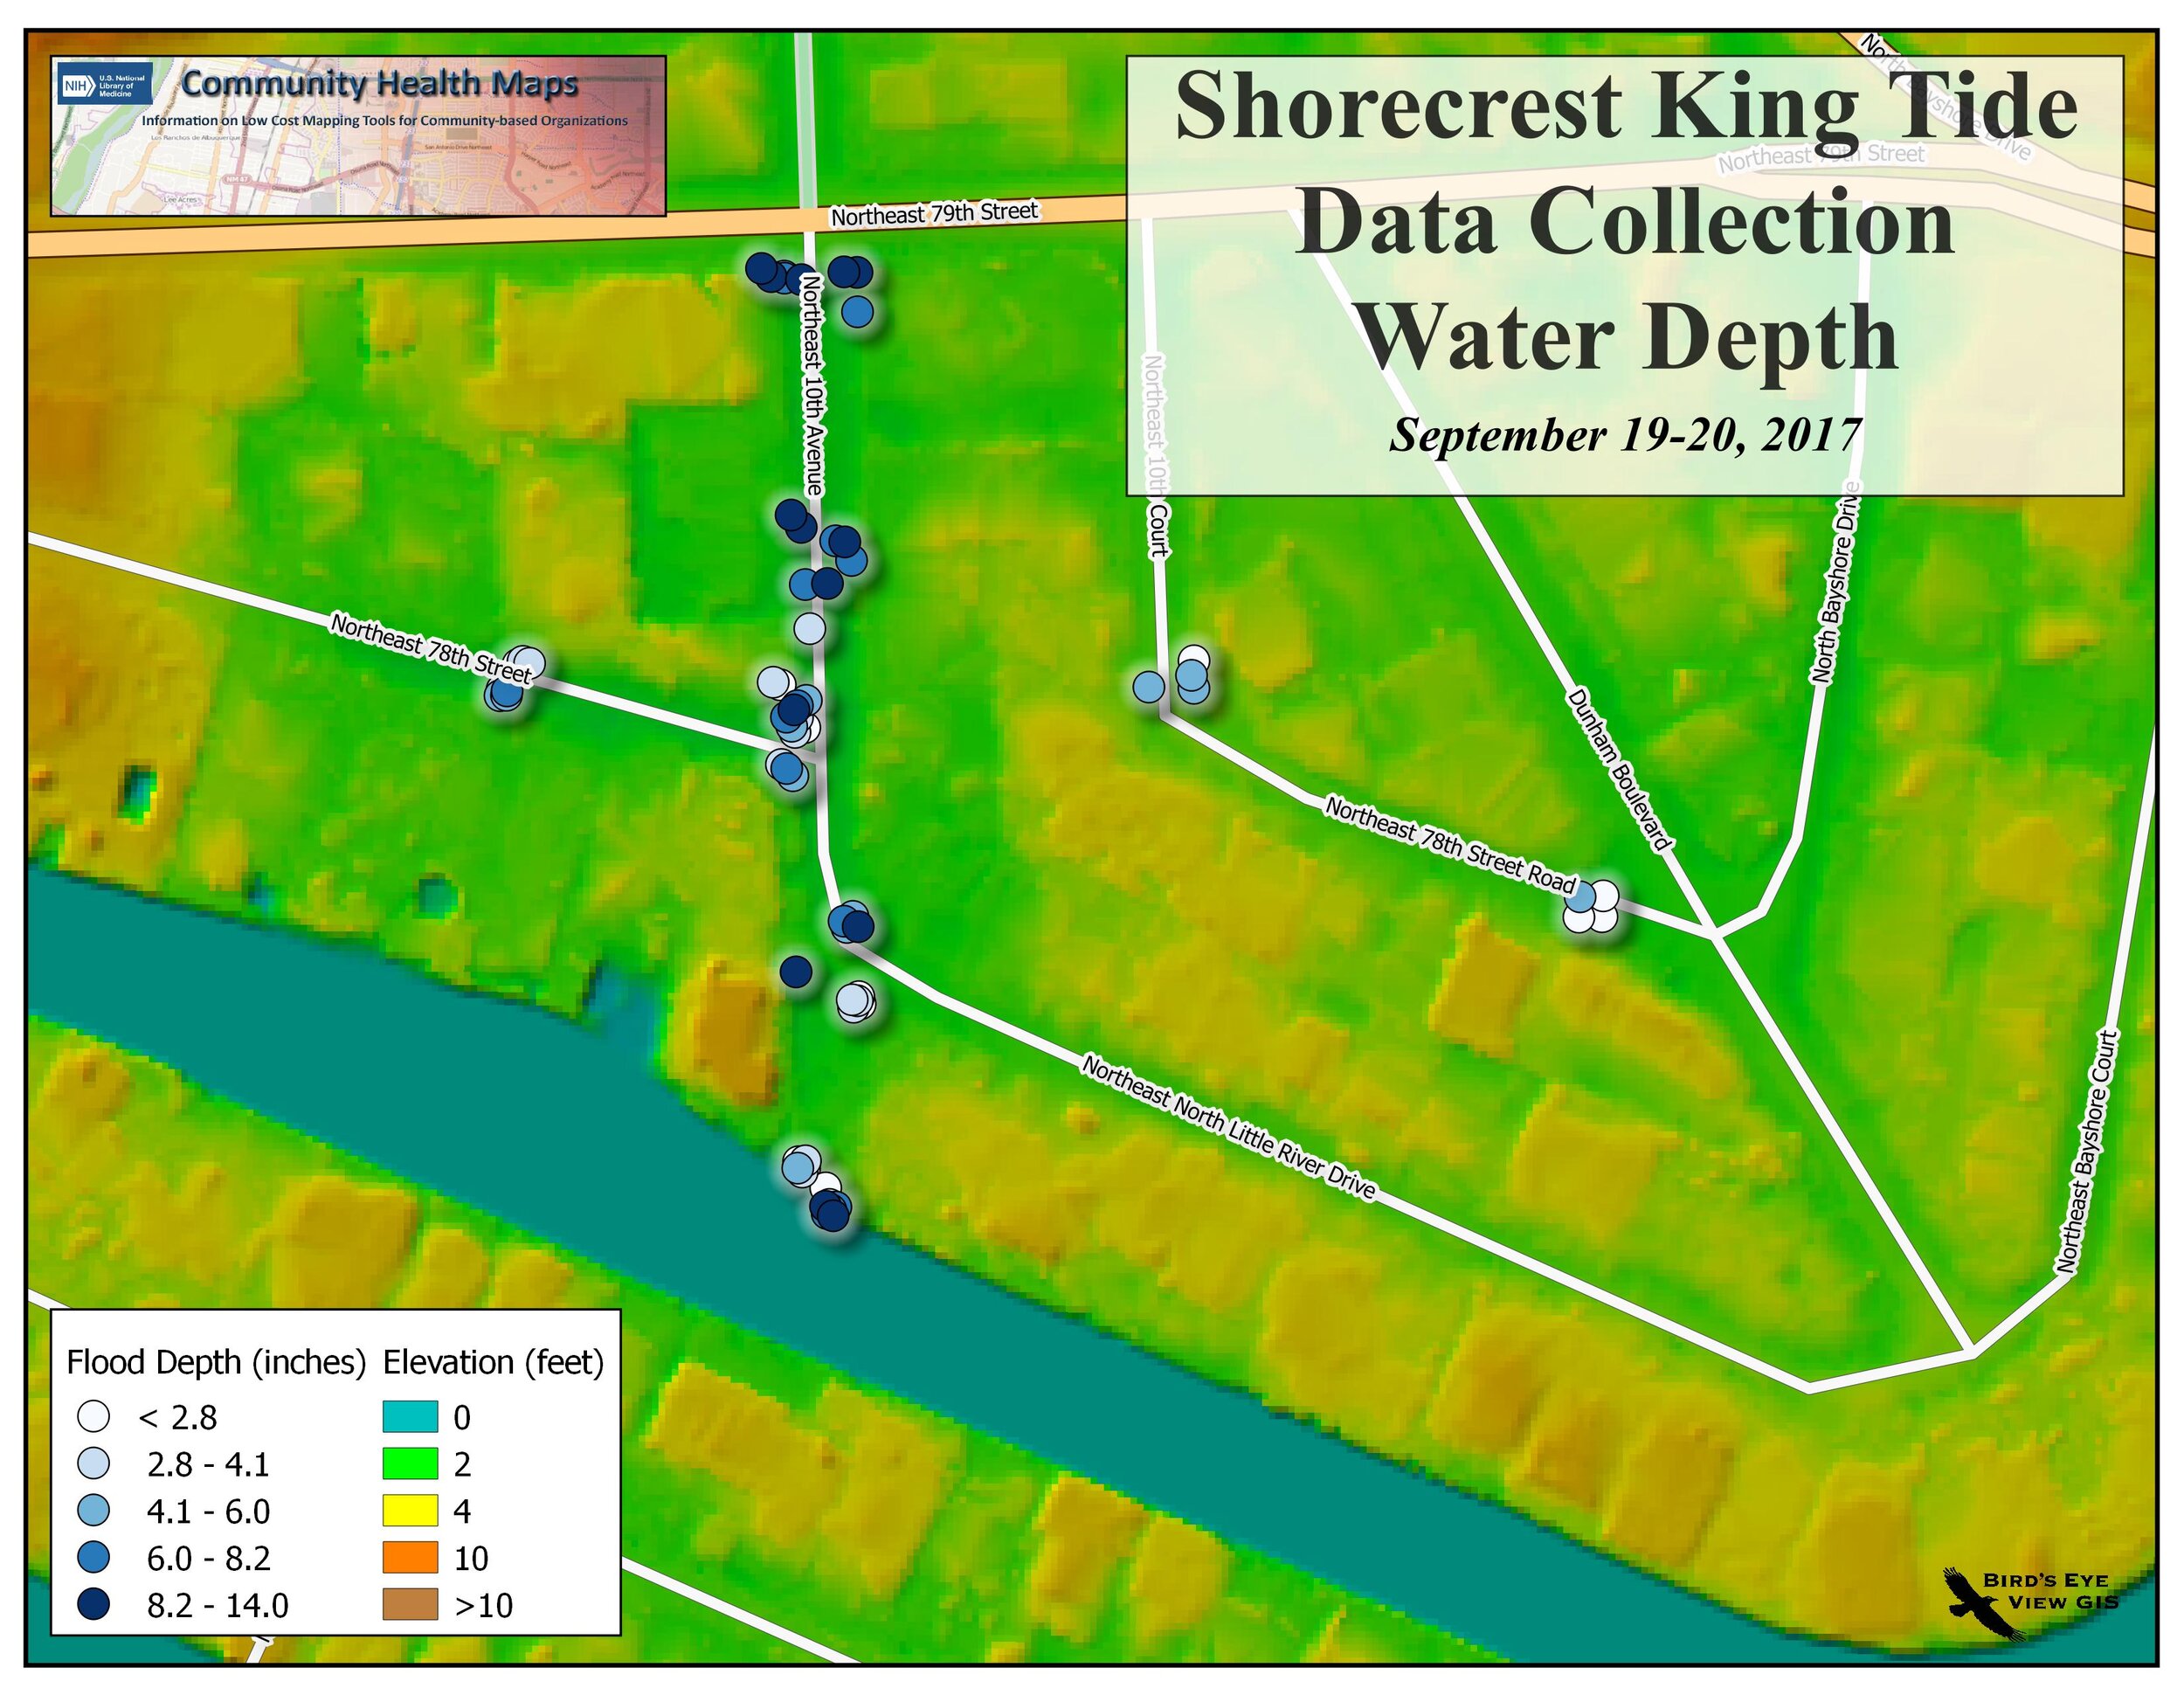
Map showing water depth in comparison to elevation above sea level
While collecting data for risk maps a Miami Herald reporter stopped by the Shorecrest neighborhood where we were working. Here's his story about our initiative.